Mar 9, 2020
NIGHT MODE
DAY MODE
2020 THE PLAYERS Championship Preview
- March 9, 2020
TPC Sawgrass plays host to the PGA Tour’s flagship event this week, The Players Championship.
Sawgrass presents a unique challenge to the world’s top golfers, especially relative to what they normally face in major championships.
This article takes a look at some of the features of TPC Sawgrass that are relevant to making predictions this week.
Course Fit
A common theme this week will be the seemingly random nature of TPC Sawgrass. To start, let’s take a look at the course fit plot.
This will give us an idea of which types of golfers should be expected to perform above (or below) their baseline skill level.
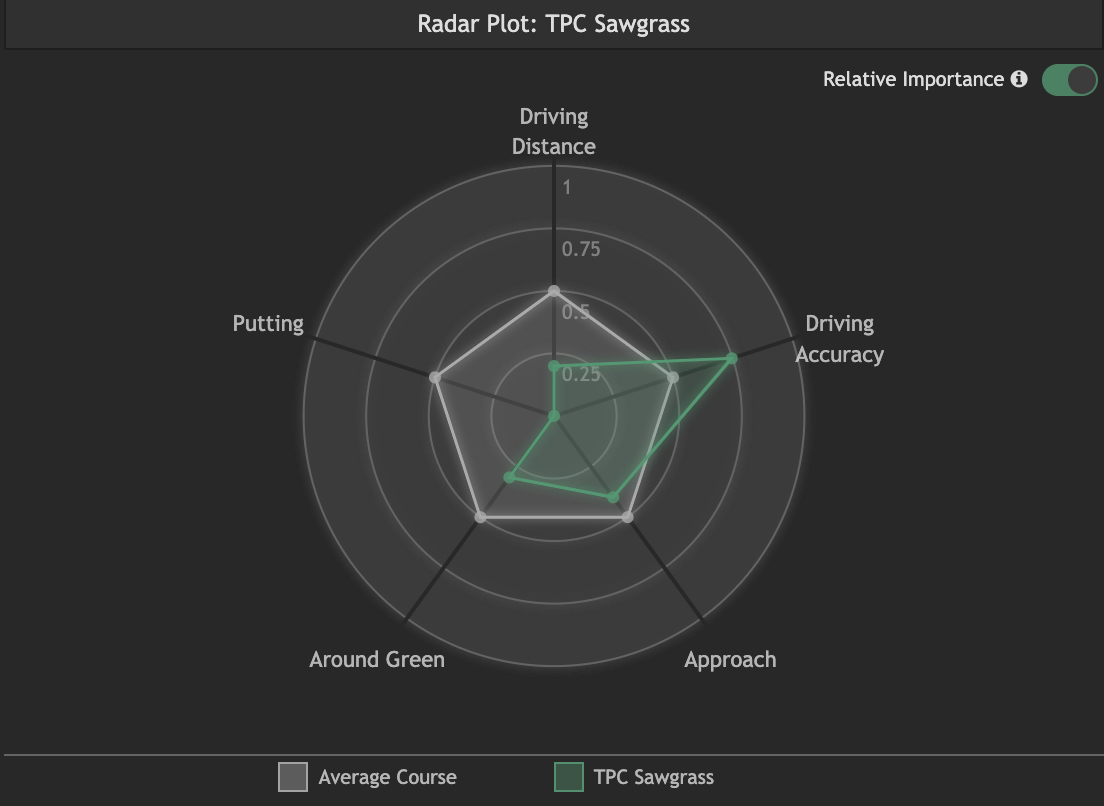
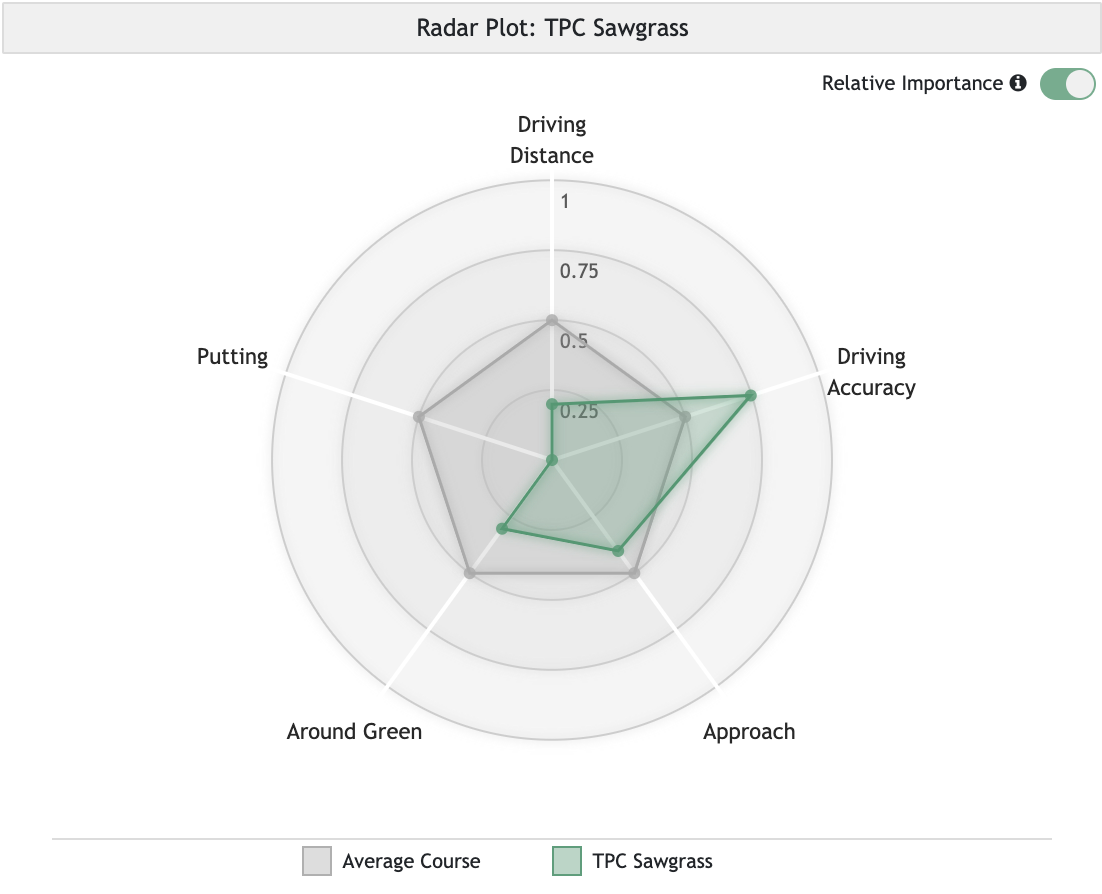
There are several noteworthy items to highlight here. First, a golfer’s driving accuracy is significantly more predictive at TPC Sawgrass than at the average PGA Tour course. Second, and likely related to the previous point, driving distance will be significantly less predictive this week than it is at the typical tour stop. Taken together, we should expect short and accurate golfers to perform above their baseline skill levels here. Third, a golfer’s historical putting performance is the least predictive of performance at TPC Sawgrass of any course on the PGA Tour! Why, you ask? No clue. Fourth, both around-the-green and approach have below-average predictive power at Sawgrass. Considering all five attributes together, the overall effect is that past performance is substantially less predictive at TPC Sawgrass; this will have the effect of compressing our predicted skill distribution (i.e. better golfers getting negative adjustments; worse golfers getting positive adjustments).
The adjustments for course fit this week are the largest we’ve made so far in the 2020 PGA Tour season; here are the three largest positive and three largest negative adjustments being made (to view fit adjustments for every player in the field, visit the player skill decomposition page):
Top 3 Positive Adjustments:
1: Jim Furyk (+0.42)
2: Ryan Armour (+0.39)
3: Brian Stuard (+0.36)
Top 3 Negative Adjustments:
1: Cameron Champ (-0.36)
2: Kevin Tway (-0.28)
3: Dustin Johnson (-0.27)
To wrap up the course fit section, it’s interesting to highlight TPC Sawgrass’ least similar course on the PGA Tour: Bethpage Black. In general, the courses that host the biggest tournaments in golf tend to favour driving distance; part of what makes The Players intriguing is that it provides a very different test compared to what we normally see on golf’s biggest stages.
Course History
The fact that most attributes have below-average predictive power at TPC Sawgrass does not imply that course history will not be important.
As was alluded to earlier, when golfer skill does not correlate as strongly with performance at a course, this is effectively good course fit for below-average golfers (which should lead to good course history, in theory).
However, despite the abundance of golfers with long histories at TPC Sawgrass, there are relatively few players who have over or under-performed their baselines by a large margin. It’s not clear exactly why this is the case; one partial explanation could be that when players go from being below-average to above-average (from one year to the next) their course fit changes from good to bad.
In any case, it turns out that not only do most golfers not have especially good or bad records of historical performance at TPC Sawgrass, it is also the case that these histories are relatively less predictive of future performance than are the same histories from others courses (e.g. +1 strokes-gained relative-to-baseline for 10 rounds predicts future performance better at Augusta National than it does at Sawgrass).
As a result, there are only a few golfers this week that are receiving meaningful course history adjustments: Henrik Stenson, Matt Kuchar, and Si Woo Kim (all past Players champions) are all receiving positive adjustments to their skill levels of over 0.1 strokes, while Aaron Baddeley and Harris English are the only two players receiving downward adjustments of at least 0.1 strokes.
Course-Specific Variance
Next let’s think about variance.
So far we have documented that a golfer’s historical performance (i.e. their skill level) is less predictive of performance at TPC Sawgrass than at the typical PGA Tour course.
To use an example, if we expect Rory McIlroy to beat the average PGA Tour player by 2.5 strokes at a neutral course, we might only expect this scoring difference to be 2.2 strokes at TPC Sawgrass.
However, there is the related, but separate, question of the unexplained variance in performance at Sawgrass.
To see this with extreme examples, first consider a case where McIlroy always beats the average PGA Tour player at Sawgrass by between 2.0 and 2.4 strokes per round (i.e. low course-specific variance); then, consider a second case where this scoring gap is between -6 and +8 strokes per round (i.e. high course-specific variance).
In both examples the average scoring difference can be assumed to be 2.2 strokes per round to illustrate the point that course-specific variance is a separate question to be considered.
Since 2004, TPC Sawgrass has been a high variance course. That is, not only do we predict golfers' skill levels to be closer together at Sawgrass, it is also the case that the random component of scores has greater variance too. (These two facts are related, but it is not a mechanical relationship). Shown in the plot below is the standard deviation in the random part of scores (i.e. that not due to differences in skill) from all courses on the PGA Tour where at least 40 rounds have been played since 2004:
Standard deviation of scores (by course): 2004 - 2020
To provide a simpler, and possibly misleading, look at the effect of variance on win probabilities, here is the average ranking (according to our metrics) of the winner of each the major championships and the Players since 1983:
Average Field Rank of Winner: 1983 - 2019
U.S. Open
15
The Masters
17
PGA Championship
21
PLAYERS Championship
21
The Open Championship
32
Only The Open Championship has had winners with a worse average ranking than those of the Players Championship since 1983. At the same time, the average ranking of the winners of the three other major championships are not substantially better, reflecting the fact that there have been several top players who have won The Players over the years.
Betting on Course-Specific Adjustments
Sorry, this information is restricted to Scratch Members only.
To view the full article and gain access to the rest of our site, sign up here.